Comparing GTAP ILUC results to observations of ethanol related land use change

For over ten years, indirect land use change modeling has been an important part of assessing the environmental impact of U.S. biofuel policy. While several models have been developed to undertake these assessments, notably the FAPRI-FASOM model used by the Environmental Protection Agency (EPA) in determining the lifecycle emissions of fuels supported by the Renewable Fuel Standard (RFS) (U.S. Environmental Protection Agency, 2010), the most prolific use of a single model has been the GTAP computational general equilibrium model, used for regulatory analysis by the California Air Resources Board (California Air Resources Board, 2014), in the Argonne National Laboratory’s GREET model (Argonne National Laboratory, 2017) and in a sequence of independent analyses by researchers. The GTAP model itself does not include land use change emission factors, and thus areal land use change results output from GREET must be coupled to emission factor models to produce ILUC results in terms of carbon dioxide emissions per unit of energy produced.

One notable feature of the ILUC factor results reported using the GTAP model over the past decade is that they have shown a tendency to reduce over time, as shown for in the figure below for corn ethanol.

Point ILUC factor estimates for US corn ethanol obtained with variants of the GTAP-BIO model

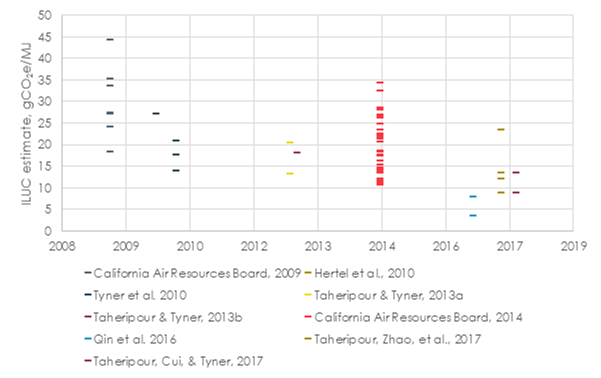
A forthcoming academic paper[1] will discuss in detail the underlying analytical reasons for these reductions, and queries whether the changes to the model and emissions factors that have driven these changes have been adequately justified. While assessing modeling choices is an interesting exercise, it is also enlightening to compare reported model results to observed changes in U.S. agriculture. One source for observed data on U.S. land use changes that may be associated with the growth of the corn ethanol industry is a series of papers by researchers at the University of Wisconsin (including Lark, Salmon, & Gibbs, 2015; Wright et al., 2017), which use data from the USDA cropland data layer (CDL). Here, we compare ILUC results for corn that are documented by Qin, Dunn, Kwon, Mueller, & Wander (2016) against the observed land use changes in the U.S. in the period 2008-2012 documented in Wright et al. (2017).

Qin et al. (2016) give one of the lowest corn ILUC numbers available in the literature, as low as 2.1 gCO2e/MJ at the bottom end of the interval given (the range reflects different yield and tillage assumptions), but are these results consistent with observed land use changes? Below, the reported model outputs from the ‘Corn2’ scenario in  Qin et al. (2016)[2] are considered, and compared to agricultural statistics and the results of the analysis presented in (Wright et al., 2017) for the years 2008-2012, during which ethanol productions increased by 4.2 billion gallons. It is important to note up front that it is always difficult to compare observed land use changes to the results of indirect land use change models. It is generally not possible to definitively identify whether a given land use change would have occurred in the absence of biofuel demand. In contrast, in ILUC modeling we know by hypothesis that all land use changes reported are due to biofuel demand. Apparent inconsistencies between observed land use data and ILUC models may have several reasonable explanations. The results noted below cannot refute the results of the modeling, but do perhaps suggest that some model assumptions ought to be reexamined. 

Qin et al. (2016) consider an increase of biofuel demand by 11.59 billion gallons (the ‘shock’), which is about equivalent to the increase in ethanol production in the U.S. between 2004 and 2015 (based on data from the EIA[3]), and assess how much land use change was likely to have been caused by that increase. Given average corn production[4] and ethanol refinery[5] yields for the period 2011-2015, producing a billion gallons of ethanol requires about a million hectares of corn. The net cropland expansion in the U.S. modeled by Qin et al. (2016) is much less than this however, only 160 thousand hectares per billion gallons of additional corn ethanol demand. Almost all of the U.S. land use change (154 thousand hectares per billion gallons) was modeled coming from a category of land identified as ‘cropland pasture’ – defined by the USDA as land that at some previous point was cropped, and is still suitable for cropping, but since then has been use as pasture. A further 112 thousand hectares of land use change per billion gallons are predicted outside the U.S. That the net cropland expansion modeled should be less than the absolute cropland requirement is not surprising to anyone familiar with ILUC modeling. There are several effects that reduce net requirements for additional land – notably these include the use of co-products from ethanol production (distillers’ grains) as animal feed, reducing demand for food[6], and the possibility that agricultural productivity increases (Malins, Searle, & Baral, 2014). While it is not surprising that the net land requirement is less than the gross requirement, it is clear that GTAP is modelling a strong role of responses other than land use change in meeting additional corn demand, given that the net land demand is only about a quarter of the gross. 

Wright et al. (2017), looking at satellite data, identify 1.1 million hectares of land within 50 miles of ethanol refineries being converted from non-crop status to cropping in the period 2008-2012, with most of this land (700 thousand hectares) converted to corn or soybean cropping. A further 600 thousand hectares of land from 50 to 100 miles from ethanol refineries was converted from non-crop statuses, though over half of this was planted with other crops. Further than 100 miles from corn ethanol refineries only 20% of newly converted land was planted with corn or soybeans[7]. Wright et al. (2017) argue that depending on the mix of rotations adopted (how much land remains in corn-soy rotation and how much is given over to continuous corn) then their analysis would be consistent with between 500,000 and 1 million hectares of previously uncropped land being converted for corn production within 100 miles of ethanol refineries over the period considered. If all of this additional corn area could indeed be attributed to the corn ethanol mandate, that represents somewhere between 130 thousand and 260 thousand hectares of land use change to corn production for every billion gallons of additional ethanol demand in that period, comparable to the modelled values. Data from the AFDC[8] shows that during this period use of corn for non-fuel applications reduced, so it is not unreasonable to assume that most conversion of uncropped land to corn production in this period was a response to the corn ethanol mandate. Preliminary analysis by the same group (Lark et al., 2019) estimates that 1.1 million hectares of land conversion since 2005 is associated with the ethanol mandate of the RFS2, about 200 thousand hectares per billion gallons.

Another comparison point comes from related work supported by the National Wildlife Federation (Hendricks, 2018), which aims to provide an economic assessment of the impact of the RFS2 on land use changes in the period 2008-2016  using data from the National Resources Inventory (NRI). This assessment attributes 1.2 million hectares of net new cropland in the period 2009-2016 to the RFS, predominantly coming from conversion of former CRP land. If all of this was associated with the corn mandate, it would be equivalent to about 190 thousand hectare per additional billion gallons of ethanol production – part of this expansion ought to be associated to the biodiesel mandate, and so the overall conclusion is quite comparable to the U.S. land use change modeled by (Qin et al., 2016).

While the realized rates of land use change for corn ethanol production identified in these studies are comparable to those modeled by Qin et al. (2016), there is evidence that the role of the cropland pasture land category as a source of cropland may be dramatically overstated by the GTAP modeling. For example, using the same dataset as considered by Wright et al. (2017), this study finds that 22% of newly cropped land in the period 2008-2012 was converted from “long-term (20 + year) unimproved grasslands”. This compares to the (Qin et al., 2016) result in which at most 5% of converted grasslands could have possibly have fallen into the long-term unimproved category[9]. The cropland pasture category in GTAP does not directly correspond to any single land category in the University of Wisconsin assessments, but the observations certainly suggest that assuming that over 90% of new cropland associated with ethanol demand comes from cropland pasture is likely to be a considerable over-estimate. The economic analysis by (Hendricks, 2018) also gives a very different result to the GTAP modeling. This economic analysis suggests that over 95% of grassland converted to cropping due to RFS was former CRP land. As CRP land is not pastured, it does not fall under the definition of cropland pasture in the agricultural census, and indeed GTAP has a separate category for CRP land introduced at the same time as the cropland pasture category.   

Lark et al. (2015) also document rates of forest land conversion to cropland that appear to be larger than anticipated by Qin et al. (2016)[10], although it is even more difficult for these relatively small forest area changes to draw a firm conclusion about whether this should be attributed to the ethanol mandate.

These discrepancies regarding the source of new land are potentially important in the ILUC analysis, because different land use changes have very different assumed carbon losses in the modeling. In particular, when using the CCLUB emission factors included in the GREET model the conversion of cropland pasture to corn is assumed to result in an increase in carbon sequestration, whereas Lark et al. (2015) argue that the conversion to cropland they identify is likely to be associated with very significant carbon dioxide emissions. This fundamentally different interpretation seems to arise primarily due to the use of a rather questionable modeling assumption in the development of the CCLUB emission factors. In CCLUB, soil carbon under the cropland pasture land use is modeled using DAYCENT and treating cropland pasture as if it has uniformly been cropped before 1951, then used as pasture for 25 years before spending the last 35 years being farmed for a generic crop. This land use history is almost the opposite of the cropland pasture definition (previously cropped but then used as pasture for several years. Combining this difficult to justify modeling choice with the high rates of cropland pasture conversion modeled with GTAP by Qin et al. (2016) leads to a dramatic reduction in the predicted ILUC factor. 

The importance of these emission factor assumptions can be further illustrated by comparing the average carbon loss per hectare assumed for conversion of grassland to cropland in Qin et al. (2016) (for the Corn2 scenario with CCLUB emission factors) with average values estimated by Spawn, Lark, & Gibbs (2012) for grassland conversion in the Lark et al., (2015) results. Spawn et al. (2012) estimate an average loss of about 50 tonnes of carbon per hectare for conversion of new land to corn agriculture. Qin et al. (2016) in contrast assume an average increase by 13 tonnes of carbon stored per hectare.

Summary

Recent analysis with the GTAP model has suggested that ILUC emissions from corn ethanol may be much lower than was calculated in either the initial or revised ILUC analysis for the California Air Resources Board, or by the US Environmental Protection Agency. The results from Qin et al. (2016) using GTAP with the CCLUB emission factor model have even been integrated into the GREET lifecycle analysis model. Comparing these GTAP results to land use changes identified by other sources, however, suggests that total U.S. land use changes may be slightly underestimated, and strongly suggests that the role of cropland pasture as a land source may be significantly exaggerated. These features of recent GTAP modeling, combined with highly questionable assumptions about carbon sequestration when cropland pasture is converted to corn cropping have likely led to significant underestimates of likely ILUC emissions.

References

Argonne National Laboratory. (2017). The Greenhouse gases, Regulated Emissions, and Energy use in Transportation Model. Retrieved August 2, 2018, from https://greet.es.anl.gov/

California Air Resources Board. (2014). Appendix I – Detailed analysis for indirect land use change. Sacramento, CA. Retrieved from https://www.arb.ca.gov/regact/2015/lcfs2015/lcfs15appi.pdf

Hendricks, N. P. (2018). The Impact of the Renewable Fuels Standard on Cropland Transitions.

Lark, T. J., Hendricks, N. P., Pates, N., Smith, A., Spawn, S. A., Bougie, M., … Gibbs, H. K. (2019). IMPACTS OF THE RENEWABLE FUEL STANDARD ON AMERICA ’ S LAND AND WATER. In American Academy for the Advancement of Science (AAAS) Annual Meeting (pp. 1–13). Washington DC.

Lark, T. J., Salmon, J. M., & Gibbs, H. K. (2015). Cropland expansion outpaces agricultural and biofuel policies in the United States. Environmental Research Letters, 10, 44003. Retrieved from http://stacks.iop.org/1748-9326/10/i=4/a=044003

Malins, C., Searle, S. Y., & Baral, A. (2014). A Guide for the Perplexed to the Indirect Effects of Biofuels Production. International Council on Clean Transportation. Retrieved from http://www.theicct.org/guide-perplexed-indirect-effects-biofuels-production

Qin, Z., Dunn, J. B., Kwon, H., Mueller, S., & Wander, M. M. (2016). Influence of spatially dependent, modeled soil carbon emission factors on life-cycle greenhouse gas emissions of corn and cellulosic ethanol. GCB Bioenergy, 8(6), 1136–1149. http://doi.org/10.1111/gcbb.12333

Spawn, S. A., Lark, T. J., & Gibbs, H. K. (2012). U.S. cropland expansion released 115 million tons of carbon (2008-2012). In America’s Grasslands Conference 11/15/2017, Fort Worth, TX. Fort Worth. Retrieved from http://www.gibbs-lab.com/wp-content/uploads/2017/11/spawn_Summary.pdf

U.S. Environmental Protection Agency. (2010). Renewable Fuel Standard Program (RFS2) Regulatory Impact Analysis, 2010(February 2010), 1109. http://doi.org/EPA-420-R-10-006., February 2010

Wright, C. K., Larson, B., Lark, T. J., Gibbs, H. K., Salmon, J. M., Gibbs, H. K., … Gibbs, H. K. (2017). Recent grassland losses are concentrated around U. S. ethanol refineries. Environmental Research Letters, 12(4), 044001. http://doi.org/10.1088/1748-9326/aa6446

Acknowledgement

This article was supported by the National Wildlife Federation.


[1] Malins, C., Plevin, R., Edwards, E. (2019). Accentuating the positive – how robust are reductions in modeled estimates of the indirect land use change from conventional biofuels?

[2] Referred to in the CCLUB module of GREET as the ‘Corn 2013’ scenario.

[3] https://www.eia.gov/dnav/pet/hist/LeafHandler.ashx?n=pet&s=m_epooxe_ynp_nus_mbbl&f=a  and http://www.eia.gov/totalenergy/data/annual/showtext.cfm?t=ptb1003

[4] USDA NASS

[5] Calculated from AFDC data on total corn use for ethanol https://afdc.energy.gov/data/10339

[6] In the case of feed corn, this would primarily mean reducing demand for animal products and therefore reducing use of corn as animal feed.

[7] Corn and soy are often grown in rotation.

[8] https://afdc.energy.gov/data/10339

[9] Of a total 1.9 million acres of conversion of cropland pasture plus other grassland in GTAP-CCLUB, 95% was from cropland pasture.

[10] In 2008-12 nineteen thousand hectare of forest conversion for every additional billion gallons of ethanol demand, about half of it identified by (Wright et al., 2017) as within 100 miles of ethanol refineries  compared to 6 thousand hectares per billion gallons in (Qin et al., 2016).

Accentuating the positive – has optimism bias driven reductions in ILUC estimates?

Indirect land use change, often abbreviated to ILUC, refers to the expected expansion of agricultural area (and subsequent release of carbon from biomass and soils) when biofuel policies increase demand for agricultural commodities. In 2008, research led by Tim Searchinger using the FAPRI economic model[1] suggested that accounting for these ILUC emissions might eliminate the presumed climate benefit of using corn ethanol, but more recent analyses have suggested that the ILUC effect is much smaller than originally suggested. ILUC cannot be measured directly, because by definition it is an indirect effect where causality is mediated by market mechanisms, and so researchers have developed complex systems of economic modeling to produce scenarios for the way we might expect the agricultural system to react to increased biofuel demand.

In the U.S., one of these models has taken an increasingly dominant role in ILUC analysis – GTAP, the computable general equilibrium economic model of the Global Trade Analysis Project. Results from GTAP are used in the Low Carbon Fuel Standard regulation in California, and have been integrated into the GREET (Greenhouse gases, Regulated Emissions, and Energy use in Transportation) model of the Argonne National Laboratory. With a steady stream of results, updates and model adjustments, the ILUC research using GTAP is probably the most prolific ILUC modeling strand in the world in terms of the number of papers published and ILUC estimates recorded.

In 2009 when the California Air Resources Board first regulated for ILUC emissions, they estimated the ILUC from corn ethanol production at 30 gCO2e/MJ[2] and the ILUC from soy biodiesel at 62 gCO2e/MJ. More recent GTAP estimates, however, have been as low as 10 gCO2e/MJ for both fuels (e.g. Chen et al., 2018; Qin, Dunn, Kwon, Mueller, & Wander, 2016). The figure below shows the downward tendency over time in ILUC estimates reported for soy biodiesel using GTAP. A reduction by 20 gCO2e/MJ or more in estimated ILUC emissions can significantly affect our understanding of how much climate benefit a fuel delivers, and by affecting regulatory treatment of biofuels a lower lifecycle carbon emissions value can have large financial implications.


Point ILUC factor estimates for US corn ethanol obtained with variants of the GTAP-BIO model

Given the very large reported reductions in estimated ILUC in some of the lower results compared to the initial CARB assessments, up to a 60% reduction for corn ethanol and a 90% reduction for soy biodiesel, it is useful to understand why the numbers have fallen so far. A forthcoming paper co-authored by Chris Malins of Cerulogy reviews in detail innovations introduced to the modeling framework since 2009, and concludes that the evidentiary basis for many of the changes that have led to reduced ILUC estimates is weak.

The review looks in particular at changes made to the model in five areas over the past decade, reviewing the strength of evidence for the changes made and the impact of the changes: the intensive yield response; the role of cropland pasture; cropping intensity change; yield at the extensive margin; and the emission factors associated with land use changes.

Intensive yield change

The intensive yield change refers to the amount that agricultural yields can be increased in response to increased demand. A strong intensive yield response means less extra land is needed to produce biofuel feedstock. The GTAP modelers have generally preferred a value of 0.25[3] as a central estimate for this parameter, based on analysis of historical corn yields. There have however always been highly divergent expert opinions on this question. For example, economist Steve Berry argued in a report for the Air Resources Board that there is no robust econometric evidence for the value of 0.25, and that ta value of 0.1 would be more appropriate given the data available.[4]  

While the Air Resources Board ended up using a reduced average yield response value in its 2014 regulatory modeling (compared to the value of 0.25 used in its 2009 work), subsequent studies with GTAP have continued to be based on the parameter of 0.25. Indeed, since 2017 the response has effectively been increased even further, due to a model amendment which implemented differentiated yield response by region, but increased it in more regions than it was reduced in. These asymmetric changes were made despite presenting no evidence that the previous yield response had been too weak on average.

For assessing the ILUC of soy biodiesel, it is also important to note that there is some evidence in the literature that the yield response for soybeans is much weaker than that for corn. Applying differentiated yield responses for other crops would therefore likely have increased ILUC results, especially for soy biodiesel. It is doubly unfortunate for the soy analysis that while regional yield responses have been implemented in a way that strengthens the yield response for all feedstocks, but no action has been taken to differentiate in the modeling the yield response of different crops.     

Cropland pasture

Cropland pasture is a land category in USDA reporting that refers to areas that are currently pastured but that have been used for annual crops in the (relatively) recent past. This land category was added to the GTAP database for the U.S. and Brazil in 2010, presumed to have lower carbon stocks than other land types. The model assumes that conversion of cropland pasture to crop production is easier than conversion of forest or permanent pasture, and so introducing this land category immediately reduced ILUC emissions. Since then, a sequence of amendments to model structure and parameters have continually increased the importance of cropland pasture conversion in the model results.

While cropland pasture has taken on a central role in the GTAP modeling, the evidence that it is so readily converted to cropland is actually rather patchy. Statistical data on cropland pasture area is complicated by the fact that the wording of USDA questionnaires has changed, which USDA believe may have caused a large reduction in reported areas. Despite the lack of evidence to support such a major change to the modeling, a large elasticity of cropland pasture yield to rent was subsequently introduced, also without any direct evidence to support the value chosen. Changes made in 2013 to regionalize the land use changes associated with price increases further reduced the likelihood of forest or permanent pasture conversion in many regions, based on weak evidence, thus again increasing the role of cropland pasture still further. An alternative regional approach suggested in a 2012 paper would have given a more balanced result, but has subsequently been ignored.   

Cropping intensity

Cropping intensity refers to the number of times a given area of land can be harvested in one year. Traditional annual cropping includes only one harvest, but especially in warmer climates it may be possible to grow two or even more crops in a single year. This possibility was not explicitly included in the original GTAP ILUC modeling, although some experts argued that it was taken into account through the yield response. Since 2017, increased cropping intensity has been supported by GTAP modeling, and as one might expect has further reduced predicted ILUC emissions. Most countries do not directly report on cropping intensity, and thus analysis of cropping intensity changes has tended to rely on comparing harvested and planted area data, even though datasets may not be readily comparable. No analysis has been presented that robustly demonstrates a link between demand or price increases and increased cropping intensity – major weaknesses in one of the studies used to justify introducing a strong response are documented in the appendix to a previous paper.[5]  

Extensive yield

In general, we expect that farmers will preferentially plant the best land available to them, and therefore that yields will be higher on land already being farmed than on areas where agriculture expands. In the earlier GTAP modeling it was assumed that new agricultural land would have a yield two thirds that achieved on land already farmed, but this was revised based on work published in 2010. A global assessment was undertaken of expected ‘net primary production’ (NPP) using an ecosystem model, and it was assumed that the difference modeled in NPP between areas under cropping and areas under natural cover would indicate the likely difference between yields on existing land and newly farmed land. Using the new system generally resulted in increased assumed yields on newly farmed land, but questions remain about whether the analytical approach used was appropriate, and whether it had adequate resolution. In particular, it has not been explained why for many regions the new results seemed to run counter to economic logic – notably, why would farmers not have been more successful in identifying and farming the most promising land? These questions have never been resolved.

Emission factors

The economic model provides a prediction for which types of land may be converted due to biofuel demand, but turning this into an emissions estimate requires making assumptions about the carbon stock changes following land use changes. Since 2014, the ILUC estimates included in the GREET model have not by default used the emission factors developed for the California Air Resources Board, instead relying on the Carbon Calculator for Land Use Change from Biofuels Production (CCLUB).[6] This model results in systematically lower ILUC estimates than are obtained when using alternative carbon stock change values.

One major reason for the difference comes back to cropland pasture. The CCLUB modeling assumes that there are significant increases in carbon sequestration when cropland pasture is converted to annual cropping. The basis for this is a somewhat baffling underlying modeling decision to treat cropland pasture as if it was under annual crops from 1976 to 2010, and then converted to corn or soy agriculture in 2011. This directly contradicts the definition of cropland pasture, which of course must have been used for pasture immediately before conversion. This odd modeling choice is compounded by some difficult-to-justify assumptions about increased carbon sequestration in corn and soy agriculture compared to other annual crops. The upshot is that cropland pasture conversion, which in real life almost certainly results in carbon losses, is treated as a carbon gain. For the soy biodiesel pathway, there are also difficult-to-justify modeling choices made that result in underestimated emissions from peat drainage associated with oil palm expansion in Southeast Asia – for instance averaging prevalence of peat soils across administrative districts with no reference to their size or suitability for palm agriculture, so that the city of Jakarta is weighted equally with areas on the oil palm frontier in Kalimantan.  

Conclusions

The more detailed review of these issues paints a picture of a systematic and chronic willingness within the community that has developed the ILUC modeling in GTAP to make modeling decisions that reduce ILUC estimates, even where the evidence is weak. The resulting downward bias in model outcomes is compounded by an apparent corresponding resistance to invest time in model amendments that would increase ILUC estimates, even where the evidence base is relatively strong. Even if strong evidence was available for the modeling changes made, choosing to focus only on changes that reduce ILUC emissions would gradually introduce a downward bias into the results. When the bar is set low for the quality of supporting evidence, this bias manifests itself in the results very quickly.  

The result is a long-term optimism bias pushing reported ILUC emissions ever lower, so that it is impossible to conclude with any confidence to what extent the reported reductions represent a real improvement in our understanding of ILUC and to what extent they reflect a subjective decision by a small group of modelers that the numbers ought to be smaller.  

ILUC emissions are important – they are used in regulatory analysis, and our understanding of ILUC informs our understanding of whether biofuel policies are effective tools to reduce climate change. New, lower ILUC results are often presented as having great policy importance – one recent paper that presented a lower ILUC value for corn ethanol concluded that, “it is important to note the importance of the new results for the regulatory process. …[because] the current estimate values are substantially less than the values currently being used for regulatory purposes.”[7]

On the contrary, reviewing the development of the GTAP model leads not to the conclusion that regulators ought to unquestioningly adopt the most recent analysis, but that it is vital that any regulatory assessment of ILUC emissions should be balanced and should not rely too heavily on the work of any single modeling group. The California process has always involved public consultation and expert workgroups, providing a degree of balance. In contrast, the ILUC results used in the GREET model are not tempered by any formal consultative process. Any future revisions to regulatory ILUC values must involve an open and honest assessment of the evidence base for all model features, and should ensure that possible model changes get equal consideration, regardless of whether they would be expected to increase ILUC emissions outcomes or reduce them.

References

California Air Resources Board. (2009). Proposed Regulation to Implement the Low Carbon Fuel Standard, Volume I, Staff Report: Initial Statement of Reasons. Sacramento, CA: California Air Resources Board. Retrieved from http://www.arb.ca.gov/regact/2009/lcfs09/lcfsisor1.pdf

California Air Resources Board. (2014). Appendix I – Detailed analysis for indirect land use change. Sacramento, CA. Retrieved from https://www.arb.ca.gov/regact/2015/lcfs2015/lcfs15appi.pdf

Chen, R., Qin, Z., Han, J., Wang, M. Q., Taheripour, F., Tyner, W. E., … Duffield, J. (2018). Life cycle energy and greenhouse gas emission effects of biodiesel in the United States with induced land use change impacts. Bioresource Technology, 251, 249–258. http://doi.org/10.1016/j.biortech.2017.12.031

Hertel, T. W., Golub, A. A., Jones, A. D., O’Hare, M., Plevin, R. J., & Kammen, D. M. (2010). Effects of US Maize Ethanol on Global Land Use and Greenhouse Gas Emissions: Estimating Market-mediated Responses. BioScience, 60(3), 223–231. http://doi.org/10.1525/bio.2010.60.3.8

Qin, Z., Dunn, J. B., Kwon, H., Mueller, S., & Wander, M. M. (2016). Influence of spatially dependent, modeled soil carbon emission factors on life-cycle greenhouse gas emissions of corn and cellulosic ethanol. GCB Bioenergy, 8(6), 1136–1149. http://doi.org/10.1111/gcbb.12333

Taheripour, F., Cui, H., & Tyner, W. E. (2017). An Exploration of agricultural land use change at the intensive and extensive margins: implications for biofuels induced land use change. In Bioenergy and Land Use Change (pp. 19–37). Retrieved from https://books.google.co.uk/books?hl=en&lr=&id=vWk9DwAAQBAJ&oi=fnd&pg=PA19&dq=An+Exploration+of+agricultural+land+use+change+at+the+intensive+and+extensive+margins&ots=DCLdhoHgYh&sig=heg7uMycBk6hpQ4W0q0jQFl9Ugc

Taheripour, F., & Tyner, W. E. (2013a). Biofuels and Land Use Change: Applying Recent Evidence to Model Estimates. Applied Sciences, 3, 14–38. Retrieved from http://www.mdpi.com/2076-3417/3/1/14

Taheripour, F., & Tyner, W. E. (2013b). Induced Land Use Emissions due to First and Second Generation Biofuels and Uncertainty in Land Use Emission Factors. Economics Research International, 2013, 1–12. http://doi.org/10.1155/2013/315787

Taheripour, F., Zhao, X., & Tyner, W. E. (2017). The impact of considering land intensification and updated data on biofuels land use change and emissions estimatesmen. Biotechnology for Biofuels, 10(1), 1–16. http://doi.org/10.1186/s13068-017-0877-y

Tyner, W. E., Taheripour, F., Zhuang, Q., Birur, D. K., & Baldos, U. (2010). Land Use Changes and Consequent CO2 Emissions due to US Corn Ethanol Production: A Comprehensive Analysis. Department of Agricultural Economics, Purdue University, 1–90. Retrieved from http://www.transportation.anl.gov/pdfs/MC/625.PDF

Acknowledgement

This article was supported by the National Wildlife Federation.


[1] http://science.sciencemag.org/content/319/5867/1238

[2] Grams of additional carbon dioxide equivalent emissions due to indirect land use change for every megajoule of biofuel produced.

[3] This is the elasticity of yield to own price, the fraction by which the yield of crops increases for every 100% increase in the price of that crop.

[4] https://www.arb.ca.gov/fuels/lcfs/workgroups/ewg/010511-berry-rpt.pdf

[5] https://www.cerulogy.com/corn-ethanol/navigating-the-maize/

[6] https://greet.es.anl.gov/publication-cclub-manual

[7] https://biotechnologyforbiofuels.biomedcentral.com/articles/10.1186/s13068-017-0877-y

Risk management

The recast Renewable Energy Directive, agreed last year, created a new category of high ILUC-risk biofuels, along with defining a role for certifying low ILUC-risk biofuels. This report, undertaken for Transport and Environment, reviews the links between biofuel feedstocks and conversion of high carbon stock land, and looks at the challenges in certifying feedstocks for avoiding displacement. It finds that both palm oil and soy oil production continue to be associated with significant deforestation, and in the case of palm oil with peat drainage, and recommends that these should be categorised as high ILUC-risk by the European Commission.

Reviewing the status of the low ILUC-risk concept, the report draws attention to the difficulty of measuring the impact of productivity improvement projects and the importance of robust demonstration of project additionality, and proposes a an outline for an effective low ILUC-risk certification.


Washington’s Clean Fuel Future

With Clean Fuel Programs (CFPs, also referred to as Low Carbon Fuel Standards) active in California, Oregon and British Columbia, and set to be introduced at the federal level in Canada, it is unsurprising that a Clean Fuel Program for Washington State is back on the political agenda. In a new report prepared for the Union of Concerned Scientists (UCS), we assess the potential supply of low carbon fuels under a Washington CFP, and the carbon savings that could be delivered. The analysis shows that a proposed 10% carbon intensity reduction target for 2028 should be readily achievable. Read more on the UCS website or download the report below:


Front cover from Washington's Clean Fuel Future

What role for electromethane and electroammonia?

Following on our 2017 report on the potential for liquid electrofuels in the European fuel mix, Transport and Environment asked Cerulogy to look at the opportunity for electromethane as a heavy duty fuel and electroammonia as a marine fuel. The report is available below, and related work by Transport and Environment is available on their website.

Cover image from Cerulogy's report on electromethane and electroammonia


Building the Perfect Beast: Designing Advanced Alternative Fuel Policy to Work

Cerulogy attended Biomass Conference and Exhibition in Copenhagen this year (2018) to present a paper on building more effective policy for advanced alternative fuel commercialisation. The paper is now available in the conference proceedings, or you can download it below.

Abstract

Since the year 2000, grand aspirations have been set for the development of a new advanced alternative fuel industry, but targets have repeatedly been missed and deployment of new facilities has delivered only a tiny fraction of the fuel production forecast by the most ambitious policies. This paper argues that one of the main reasons for this shortfall between goals and achievement is the use of policy frameworks that have not been designed to provide long-term value certainty. The setting of energetic targets for the supply of advanced alternative fuels was intended to give the market the flexibility to choose the lowest cost solutions. Instead, the value-uncertainty built into such policies as a feature has contributed to an investment environment in which high capital expenditure projects using new technologies are profoundly disadvantaged compared to high operational expenditure fuel production at first generation plants. The market has thus failed to deliver the best value long-term solutions. An alternative policy framework is proposed in which credits would be awarded for advanced alternative fuel production, and fuel suppliers would be required to support that production by buying all available credits at the end of the year at a prescribed price. That price would be fixed up to an annual supply target; beyond that annual supply target, the per-credit price would be scaled down in proportion to the degree of over-achievement in supply, allowing a firm cap to be set on the cost of support to fuel consumers. While the market would be able to expand supply until the adjusted credit price reflected marginal production costs, the high levels of price variability in existing biofuel credit markets would be avoided. It is argued that such a framework could be much more effective at driving investment than a simple mandate, while avoiding excessive costs for fuel suppliers or consumers.


California’s Clean Fuel Future

The California Air Resources Board is in the process of stakeholder engagement before setting compliance targets to 2030 for the Low Carbon Fuel Standard, and Cerulogy was asked by the NextGen Foundation, Ceres and the Union of Concerned Scientists to provide fuel supply modelling to inform the decision. The study shows that with moderate assumptions on availability of LCFS credits from various compliance pathways, carbon savings above the currently proposed 20% level could be achieved by 2030. The study was updated in April following comments received on the original version. 

March release:


April update:


Driving deforestation

As we highlighted in our report ‘For peat’s sake’, there is a well documented link between increasing palm oil demand, expansion of the cultivated area of palm oil plantations and destruction of forest and peatland ecosystems in Southeast Asia. Despite this link, and several studies suggesting that the use of biofuels produced from palm oil may cause more greenhouse gas emissions than consumption of the fossil fuels they replace, many countries still have biofuel support policies under which palm oil based biofuels are eligible to receive support. In our new report, ‘Driving Deforestation’ we review the status of biofuel policy driven demand for palm oil, and consider three scenarios for potential biofuel-driven palm oil demand between now and 2030. While some regions, notably the European Union, are considering measures that could reduce biofuel-driven palm oil demand in the coming decade, several other policies are currently set to drive dramatic increases in palm oil consumption. The largest sources of potential demand growth are the Indonesian domestic market, where a 30% target for blending biodiesel could generate 19 million tonnes of palm oil demand by 2030 (a 16 million tonne increase), and the aviation industry commitment to switch to alternative aviation fuel, which could generate 19 million tonnes of additional palm oil demand by 2030 if no controls are placed on the feedstocks eligible for support. If current land use trends continue, following the high scenario globally could cause cumulatively result in 7 billion tonnes of additional carbon dioxide emissions from land use change over the two decades from 2018 to 2038, as compared to a case in which biofuel-driven palm oil demand was eliminated. In a more likely ‘medium’ scenario, there could still be 3 billion tonnes of additional carbon dioxide emissions from land use change compared to a phase out of demand. The full report is available at the link below.


Front cover image from the Driving Deforestation report

Power to the people?

What role is there for electrofuel technologies in European transport’s low carbon future?

Liquid fuels are set to be part of the European and global transport energy supply for some time to come – and given limitations on sustainable biofuel production, the option of converting renewable electricity into petrol, diesel and jet fuel is a subject of renewed interest. This review, commissioned by the Brussels NGO Transport and Environment, considers the status and economics of electrofuel production, and the implications of a growth in electrofuel supply in the EU for electricity demand. It finds that the cost of electrofuel production, and in the particular the cost of input electricity, is a major barrier to competitiveness that looks likely to be difficult to overcome in the near future. Given the relative inefficiency of use of electricity for liquid fuel production as compared to direct supply of electricity to electric vehicles, electrofuel production should be considered as a niche solution primarily relevant in parts of transport where electrification and efficiency improvements cannot on their own deliver outcomes consistent with 2050 decarbonisation targets, notably aviation. The report also highlights the regulatory challenges of counting electricity as ‘renewable’ when used for electrofuel production, and highlights that the proposed regulatory framework under RED II could unintentionally undermine European environmental goals by double counting renewability.


Cover image from the report "What role is there for electrofuel technologies in European transport’s low carbon future?"

Devilish details…

…you’ll never believe the regulatory mistakes the EU is at risk of making in the RED II*

In a blog post just under a year ago I heralded the generally positive qualities of the European Commission’s proposal for a revised Renewable Energy Directive for the period 2021-2030 (RED II). Since then, both the European Parliament and the European Council have started to develop their positions on the legislation. Plenty of organisations have proffered opinions on some of the big picture questions posed by the Directive (what should be the level of ambition for advanced biofuels, what cap would be appropriate for food-based fuels and such), and I don’t intend to revisit any of those questions today. Instead, I’d like to talk about a few details in the draft regulatory language that might represent a real problem down the line if the Directive is implemented. Without further ado therefore, and embracing the clickbait conventions of the zeitgeist, here’s a Cerulogy listicle:

Three crazy details in the 13th November European Council draft of RED II that could have regulators (and environmentalists and investors) tearing their hair out in the years to come

1.    An inadequate definition of ‘low iLUC risk’ biofuels

The proposed RED II caps the extent to which food-based biofuels can be used to meet renewable energy targets at 7%, but it creates a get-out for food-based fuels that meet the definition of being, ‘low indirect land-use change-risk biofuels and bioliquids’. The idea of low ILUC-risk biofuels has been around for years, and it’s fundamentally a sensible idea. If displacing existing uses of food-commodities causes ILUC, why don’t we just avoid displacing existing uses? It’s an idea that was supported in the Gallagher Review, and that I myself have spoken in favour of on several occasions. The problem (as I pointed out in a blog for the ICCT a few years ago) is that it’s not enough to just say that a biofuel has low ILUC risk – this has to be robustly demonstrated, and demonstrating it is complex. If the oversight systems don’t work, you will very quickly end up certifying biofuels as ‘low ILUC risk’ even though they are nothing of the kind. Unfortunately, the current language of RED II is incredibly vague on the subject. The definition given for a low ILUC risk biofuel is that the feedstock must be ‘produced within schemes which reduce the displacement of production for purposes other than for making biofuels and bioliquids’. The definition doesn’t say how much displacement should be reduced. To avoid ILUC completely it would have to be reduced by 100%, but what about a scheme that reduces displacement by only 10%, or only 1%? Given the proposed language, Member States may find it difficult to put robust requirements in their national implementations. Before you know it, the EU will be up to its neck in palm oil from replanting programmes getting certified as low ILUC risk – even if the programmes deliver only modest yield improvements and the true ILUC impact of the palm oil is still very high indeed. The solution? The language of the Directive should be revised from ‘reducing’ displacement to ‘avoiding’ displacement, and a delegated act should be added for the European Commission to define robust protocols to evaluate schemes. Further discussion of the challenges of ILUC mitigation is available in this ICCT paper.

2.    Double counting renewability of electrofuels

The proposed Directive allows electrofuels (fuels that are produced by electrolysing water to produce hydrogen and reacting the hydrogen with carbon monoxide or dioxide to produce hydrocarbons, referred to as ‘renewable fuels of non-biological origin’ in the proposed Directive), to be counted towards the transport sector obligation for renewable energy use. This is reasonable enough – liquid fuels produced from renewable electricity present much lower sustainability risks than most biofuels, and electrofuel technologies would provide a valuable additional option for producing low-carbon drop-in liquid fuels. The problem is that way that electrofuels are counted towards overall Member State renewable energy targets. Whereas advanced biofuels are counted based on the energy content of the fuel, it is proposed that electrofuels would be counted based on the amount of electricity required to produce them. Because the efficiency of conversion of electricity to drop-in fuels will be only about 40% with currently available technologies, that means that electrofuels would count two and a half times more to overall targets than advanced biofuels would. Why is this a problem? Because that means that if a Member State uses electrofuels instead of biofuels for the transport target, there is a reduced requirement for renewables in heat and power, reducing the true ambition of the renewables target. Indeed, the less efficient electrofuel production is the less renewable energy in heat and power will be needed to meet targets. The solution? Count electrofuels in the overall Member State target by the energy delivered to transport, not the energy used to produce them. Watch this space for a forthcoming Cerulogy report on electrofuels.

3.    No mechanism to deal with developing ILUC science

If there’s one thing that everyone seems to agree on about the ILUC discussion since 2009, it’s that it created uncertainty for investors considering entering the biofuel market. The draft Directive seems to be trying to create certainty by writing in ILUC values and sticking to them – the Annexes include estimated average values, and ranges, for three groups of biofuels (starchy, sugary and oily). Anything without a value is assigned an ILUC estimate of zero, and there appears to be no accommodation for the values to be revised to reflect new evidence. Also, while the initial proposal provided a general power for Member States to “distinguish between different types of biofuels and bioliquids produced from food and feed crops”, the latest Council edit restricts that power to “categories set out in Annex VIII”. That appears to mean no distinction between different feedstocks in a category. Given that more recent ILUC analysis for the Commission suggests, for instance, that palm oil biodiesel could have four times the ILUC of some other vegetable oils, it seems both shirt-sighted and ill-judged to preclude Member States from taking evidence on differences in ILUC impact into consideration. More generally, while there are certainly those in industry who believe that locking in ILUC estimates in this way reduces future uncertainty, I disagree. Rather than preventing ILUC from becoming an issue again in the 20s, I think this rigidity almost guarantees it. By preventing the Commission from adjusting to new science through delegated acts, the proposed Directive guarantees that every time new evidence on ILUC comes to like, there will be calls to reopen the Directive entirely with new legislation. For the advanced alternative fuels industry, that increased risk that the Directive could be subjected to wholesale revision before 2030 can only be a barrier to fundraising. The solution? Provide greater leeway for Member States and/or the Commission to react appropriately to existing and new evidence on ILUC and other sustainability problems.

Fingers crossed for good outcomes as the process moves forward!

* Clickbait titles are just the worst aren’t they?