
Accentuating the positive – has optimism bias driven reductions in ILUC estimates?
Indirect land use change, often abbreviated to ILUC, refers to the expected expansion of agricultural area (and subsequent release of carbon from biomass and soils) when biofuel policies increase demand for agricultural commodities. In 2008, research led by Tim Searchinger using the FAPRI economic model[1] suggested that accounting for these ILUC emissions might eliminate the presumed climate benefit of using corn ethanol, but more recent analyses have suggested that the ILUC effect is much smaller than originally suggested. ILUC cannot be measured directly, because by definition it is an indirect effect where causality is mediated by market mechanisms, and so researchers have developed complex systems of economic modeling to produce scenarios for the way we might expect the agricultural system to react to increased biofuel demand.
In the U.S., one of these models has taken an increasingly dominant role in ILUC analysis – GTAP, the computable general equilibrium economic model of the Global Trade Analysis Project. Results from GTAP are used in the Low Carbon Fuel Standard regulation in California, and have been integrated into the GREET (Greenhouse gases, Regulated Emissions, and Energy use in Transportation) model of the Argonne National Laboratory. With a steady stream of results, updates and model adjustments, the ILUC research using GTAP is probably the most prolific ILUC modeling strand in the world in terms of the number of papers published and ILUC estimates recorded.
In 2009 when the California Air Resources Board first regulated for ILUC emissions, they estimated the ILUC from corn ethanol production at 30 gCO2e/MJ[2] and the ILUC from soy biodiesel at 62 gCO2e/MJ. More recent GTAP estimates, however, have been as low as 10 gCO2e/MJ for both fuels (e.g. Chen et al., 2018; Qin, Dunn, Kwon, Mueller, & Wander, 2016). The figure below shows the downward tendency over time in ILUC estimates reported for soy biodiesel using GTAP. A reduction by 20 gCO2e/MJ or more in estimated ILUC emissions can significantly affect our understanding of how much climate benefit a fuel delivers, and by affecting regulatory treatment of biofuels a lower lifecycle carbon emissions value can have large financial implications.
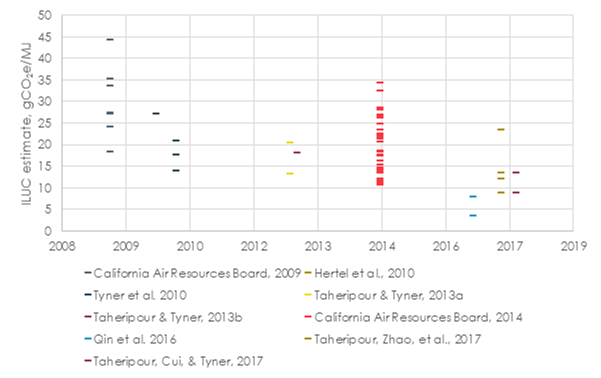
Point ILUC factor estimates for US corn ethanol obtained with variants of the GTAP-BIO model
Given the very large reported reductions in estimated ILUC in some of the lower results compared to the initial CARB assessments, up to a 60% reduction for corn ethanol and a 90% reduction for soy biodiesel, it is useful to understand why the numbers have fallen so far. A forthcoming paper co-authored by Chris Malins of Cerulogy reviews in detail innovations introduced to the modeling framework since 2009, and concludes that the evidentiary basis for many of the changes that have led to reduced ILUC estimates is weak.
The review looks in particular at changes made to the model in five areas over the past decade, reviewing the strength of evidence for the changes made and the impact of the changes: the intensive yield response; the role of cropland pasture; cropping intensity change; yield at the extensive margin; and the emission factors associated with land use changes.
Intensive yield change
The intensive yield change refers to the amount that agricultural yields can be increased in response to increased demand. A strong intensive yield response means less extra land is needed to produce biofuel feedstock. The GTAP modelers have generally preferred a value of 0.25[3] as a central estimate for this parameter, based on analysis of historical corn yields. There have however always been highly divergent expert opinions on this question. For example, economist Steve Berry argued in a report for the Air Resources Board that there is no robust econometric evidence for the value of 0.25, and that ta value of 0.1 would be more appropriate given the data available.[4]
While the Air Resources Board ended up using a reduced average yield response value in its 2014 regulatory modeling (compared to the value of 0.25 used in its 2009 work), subsequent studies with GTAP have continued to be based on the parameter of 0.25. Indeed, since 2017 the response has effectively been increased even further, due to a model amendment which implemented differentiated yield response by region, but increased it in more regions than it was reduced in. These asymmetric changes were made despite presenting no evidence that the previous yield response had been too weak on average.
For assessing the ILUC of soy biodiesel, it is also important to note that there is some evidence in the literature that the yield response for soybeans is much weaker than that for corn. Applying differentiated yield responses for other crops would therefore likely have increased ILUC results, especially for soy biodiesel. It is doubly unfortunate for the soy analysis that while regional yield responses have been implemented in a way that strengthens the yield response for all feedstocks, but no action has been taken to differentiate in the modeling the yield response of different crops.
Cropland pasture
Cropland pasture is a land category in USDA reporting that refers to areas that are currently pastured but that have been used for annual crops in the (relatively) recent past. This land category was added to the GTAP database for the U.S. and Brazil in 2010, presumed to have lower carbon stocks than other land types. The model assumes that conversion of cropland pasture to crop production is easier than conversion of forest or permanent pasture, and so introducing this land category immediately reduced ILUC emissions. Since then, a sequence of amendments to model structure and parameters have continually increased the importance of cropland pasture conversion in the model results.
While cropland pasture has taken on a central role in the GTAP modeling, the evidence that it is so readily converted to cropland is actually rather patchy. Statistical data on cropland pasture area is complicated by the fact that the wording of USDA questionnaires has changed, which USDA believe may have caused a large reduction in reported areas. Despite the lack of evidence to support such a major change to the modeling, a large elasticity of cropland pasture yield to rent was subsequently introduced, also without any direct evidence to support the value chosen. Changes made in 2013 to regionalize the land use changes associated with price increases further reduced the likelihood of forest or permanent pasture conversion in many regions, based on weak evidence, thus again increasing the role of cropland pasture still further. An alternative regional approach suggested in a 2012 paper would have given a more balanced result, but has subsequently been ignored.
Cropping intensity
Cropping intensity refers to the number of times a given area of land can be harvested in one year. Traditional annual cropping includes only one harvest, but especially in warmer climates it may be possible to grow two or even more crops in a single year. This possibility was not explicitly included in the original GTAP ILUC modeling, although some experts argued that it was taken into account through the yield response. Since 2017, increased cropping intensity has been supported by GTAP modeling, and as one might expect has further reduced predicted ILUC emissions. Most countries do not directly report on cropping intensity, and thus analysis of cropping intensity changes has tended to rely on comparing harvested and planted area data, even though datasets may not be readily comparable. No analysis has been presented that robustly demonstrates a link between demand or price increases and increased cropping intensity – major weaknesses in one of the studies used to justify introducing a strong response are documented in the appendix to a previous paper.[5]
Extensive yield
In general, we expect that farmers will preferentially plant the best land available to them, and therefore that yields will be higher on land already being farmed than on areas where agriculture expands. In the earlier GTAP modeling it was assumed that new agricultural land would have a yield two thirds that achieved on land already farmed, but this was revised based on work published in 2010. A global assessment was undertaken of expected ‘net primary production’ (NPP) using an ecosystem model, and it was assumed that the difference modeled in NPP between areas under cropping and areas under natural cover would indicate the likely difference between yields on existing land and newly farmed land. Using the new system generally resulted in increased assumed yields on newly farmed land, but questions remain about whether the analytical approach used was appropriate, and whether it had adequate resolution. In particular, it has not been explained why for many regions the new results seemed to run counter to economic logic – notably, why would farmers not have been more successful in identifying and farming the most promising land? These questions have never been resolved.
Emission factors
The economic model provides a prediction for which types of land may be converted due to biofuel demand, but turning this into an emissions estimate requires making assumptions about the carbon stock changes following land use changes. Since 2014, the ILUC estimates included in the GREET model have not by default used the emission factors developed for the California Air Resources Board, instead relying on the Carbon Calculator for Land Use Change from Biofuels Production (CCLUB).[6] This model results in systematically lower ILUC estimates than are obtained when using alternative carbon stock change values.
One major reason for the difference comes back to cropland pasture. The CCLUB modeling assumes that there are significant increases in carbon sequestration when cropland pasture is converted to annual cropping. The basis for this is a somewhat baffling underlying modeling decision to treat cropland pasture as if it was under annual crops from 1976 to 2010, and then converted to corn or soy agriculture in 2011. This directly contradicts the definition of cropland pasture, which of course must have been used for pasture immediately before conversion. This odd modeling choice is compounded by some difficult-to-justify assumptions about increased carbon sequestration in corn and soy agriculture compared to other annual crops. The upshot is that cropland pasture conversion, which in real life almost certainly results in carbon losses, is treated as a carbon gain. For the soy biodiesel pathway, there are also difficult-to-justify modeling choices made that result in underestimated emissions from peat drainage associated with oil palm expansion in Southeast Asia – for instance averaging prevalence of peat soils across administrative districts with no reference to their size or suitability for palm agriculture, so that the city of Jakarta is weighted equally with areas on the oil palm frontier in Kalimantan.
Conclusions
The more detailed review of these issues paints a picture of a systematic and chronic willingness within the community that has developed the ILUC modeling in GTAP to make modeling decisions that reduce ILUC estimates, even where the evidence is weak. The resulting downward bias in model outcomes is compounded by an apparent corresponding resistance to invest time in model amendments that would increase ILUC estimates, even where the evidence base is relatively strong. Even if strong evidence was available for the modeling changes made, choosing to focus only on changes that reduce ILUC emissions would gradually introduce a downward bias into the results. When the bar is set low for the quality of supporting evidence, this bias manifests itself in the results very quickly.
The result is a long-term optimism bias pushing reported ILUC emissions ever lower, so that it is impossible to conclude with any confidence to what extent the reported reductions represent a real improvement in our understanding of ILUC and to what extent they reflect a subjective decision by a small group of modelers that the numbers ought to be smaller.
ILUC emissions are important – they are used in regulatory analysis, and our understanding of ILUC informs our understanding of whether biofuel policies are effective tools to reduce climate change. New, lower ILUC results are often presented as having great policy importance – one recent paper that presented a lower ILUC value for corn ethanol concluded that, “it is important to note the importance of the new results for the regulatory process. …[because] the current estimate values are substantially less than the values currently being used for regulatory purposes.”[7]
On the contrary, reviewing the development of the GTAP model leads not to the conclusion that regulators ought to unquestioningly adopt the most recent analysis, but that it is vital that any regulatory assessment of ILUC emissions should be balanced and should not rely too heavily on the work of any single modeling group. The California process has always involved public consultation and expert workgroups, providing a degree of balance. In contrast, the ILUC results used in the GREET model are not tempered by any formal consultative process. Any future revisions to regulatory ILUC values must involve an open and honest assessment of the evidence base for all model features, and should ensure that possible model changes get equal consideration, regardless of whether they would be expected to increase ILUC emissions outcomes or reduce them.
References
California Air Resources Board. (2009). Proposed Regulation to Implement the Low Carbon Fuel Standard, Volume I, Staff Report: Initial Statement of Reasons. Sacramento, CA: California Air Resources Board. Retrieved from http://www.arb.ca.gov/regact/2009/lcfs09/lcfsisor1.pdf
California Air Resources Board. (2014). Appendix I – Detailed analysis for indirect land use change. Sacramento, CA. Retrieved from https://www.arb.ca.gov/regact/2015/lcfs2015/lcfs15appi.pdf
Chen, R., Qin, Z., Han, J., Wang, M. Q., Taheripour, F., Tyner, W. E., … Duffield, J. (2018). Life cycle energy and greenhouse gas emission effects of biodiesel in the United States with induced land use change impacts. Bioresource Technology, 251, 249–258. http://doi.org/10.1016/j.biortech.2017.12.031
Hertel, T. W., Golub, A. A., Jones, A. D., O’Hare, M., Plevin, R. J., & Kammen, D. M. (2010). Effects of US Maize Ethanol on Global Land Use and Greenhouse Gas Emissions: Estimating Market-mediated Responses. BioScience, 60(3), 223–231. http://doi.org/10.1525/bio.2010.60.3.8
Qin, Z., Dunn, J. B., Kwon, H., Mueller, S., & Wander, M. M. (2016). Influence of spatially dependent, modeled soil carbon emission factors on life-cycle greenhouse gas emissions of corn and cellulosic ethanol. GCB Bioenergy, 8(6), 1136–1149. http://doi.org/10.1111/gcbb.12333
Taheripour, F., Cui, H., & Tyner, W. E. (2017). An Exploration of agricultural land use change at the intensive and extensive margins: implications for biofuels induced land use change. In Bioenergy and Land Use Change (pp. 19–37). Retrieved from https://books.google.co.uk/books?hl=en&lr=&id=vWk9DwAAQBAJ&oi=fnd&pg=PA19&dq=An+Exploration+of+agricultural+land+use+change+at+the+intensive+and+extensive+margins&ots=DCLdhoHgYh&sig=heg7uMycBk6hpQ4W0q0jQFl9Ugc
Taheripour, F., & Tyner, W. E. (2013a). Biofuels and Land Use Change: Applying Recent Evidence to Model Estimates. Applied Sciences, 3, 14–38. Retrieved from http://www.mdpi.com/2076-3417/3/1/14
Taheripour, F., & Tyner, W. E. (2013b). Induced Land Use Emissions due to First and Second Generation Biofuels and Uncertainty in Land Use Emission Factors. Economics Research International, 2013, 1–12. http://doi.org/10.1155/2013/315787
Taheripour, F., Zhao, X., & Tyner, W. E. (2017). The impact of considering land intensification and updated data on biofuels land use change and emissions estimatesmen. Biotechnology for Biofuels, 10(1), 1–16. http://doi.org/10.1186/s13068-017-0877-y
Tyner, W. E., Taheripour, F., Zhuang, Q., Birur, D. K., & Baldos, U. (2010). Land Use Changes and Consequent CO2 Emissions due to US Corn Ethanol Production: A Comprehensive Analysis. Department of Agricultural Economics, Purdue University, 1–90. Retrieved from http://www.transportation.anl.gov/pdfs/MC/625.PDF
Acknowledgement
This article was supported by the National Wildlife Federation.
[1] http://science.sciencemag.org/content/319/5867/1238
[2] Grams of additional carbon dioxide equivalent emissions due to indirect land use change for every megajoule of biofuel produced.
[3] This is the elasticity of yield to own price, the fraction by which the yield of crops increases for every 100% increase in the price of that crop.
[4] https://www.arb.ca.gov/fuels/lcfs/workgroups/ewg/010511-berry-rpt.pdf
[5] http://www.cerulogy.com/corn-ethanol/navigating-the-maize/
[6] https://greet.es.anl.gov/publication-cclub-manual
[7] https://biotechnologyforbiofuels.biomedcentral.com/articles/10.1186/s13068-017-0877-y

